
Minds and professions
It is wonderful, when a calculation is made, how little the mind is actually employed in the discharge of any profession.
Samuel Johnson
Intelligence researchers have always found that some jobs require more intelligence than others. A rocket scientist is usually much brighter than the person serving them breakfast. The early data came from the pre-war occupations of WW1 soldiers, and later datasets have come from a variety of sources, all showing that more prestigious jobs required higher intelligence. Jensen explained that cognitively demanding jobs not only required higher intelligence, but the range of intelligence in such jobs was narrower than that of less demanding jobs. In a demanding job you need a minimum level of brains to be able to handle the problems encountered. In the less demanding ones, there will be some bright people mixed among the not-so-bright, perhaps because they want a quiet life, or are troubled in some way, or need quick money for temporary reasons. So, occupations act as selective filters, raising the required cognitive bar, and excluding those below the required minimum level thus compressing the range of the survivor’s ability.
Childhood intelligence is a good predictor of later occupational status. Within families, the brighter child later earns more than the less bright sibling. Usually, there are very high rankings between the social prestige and status of a job and the intelligence of the people in that occupation.
Here is a review from 2015
https:/emilkirkegaard.dk/en/2015/occupations-cognitive-ability-and-stereotypes
As in any research area, there is always an argument about representativeness, so finding a sample designed to be representative, which also contains cognitive and occupational data is an important step forward.
Tobias Wolfram has found such data in the UK Household Longitudinal Study
(Not just) Intelligence stratifies the occupational hierarchy: Ranking 360 professions by IQ and non-cognitive traits. Tobias Wolfram, Faculty of Sociology, Bielefeld University, Bielefeld, Germany.
Intelligence 98 (2023) 101755
https://doi.org/10.1016/j.intell.2023.101755
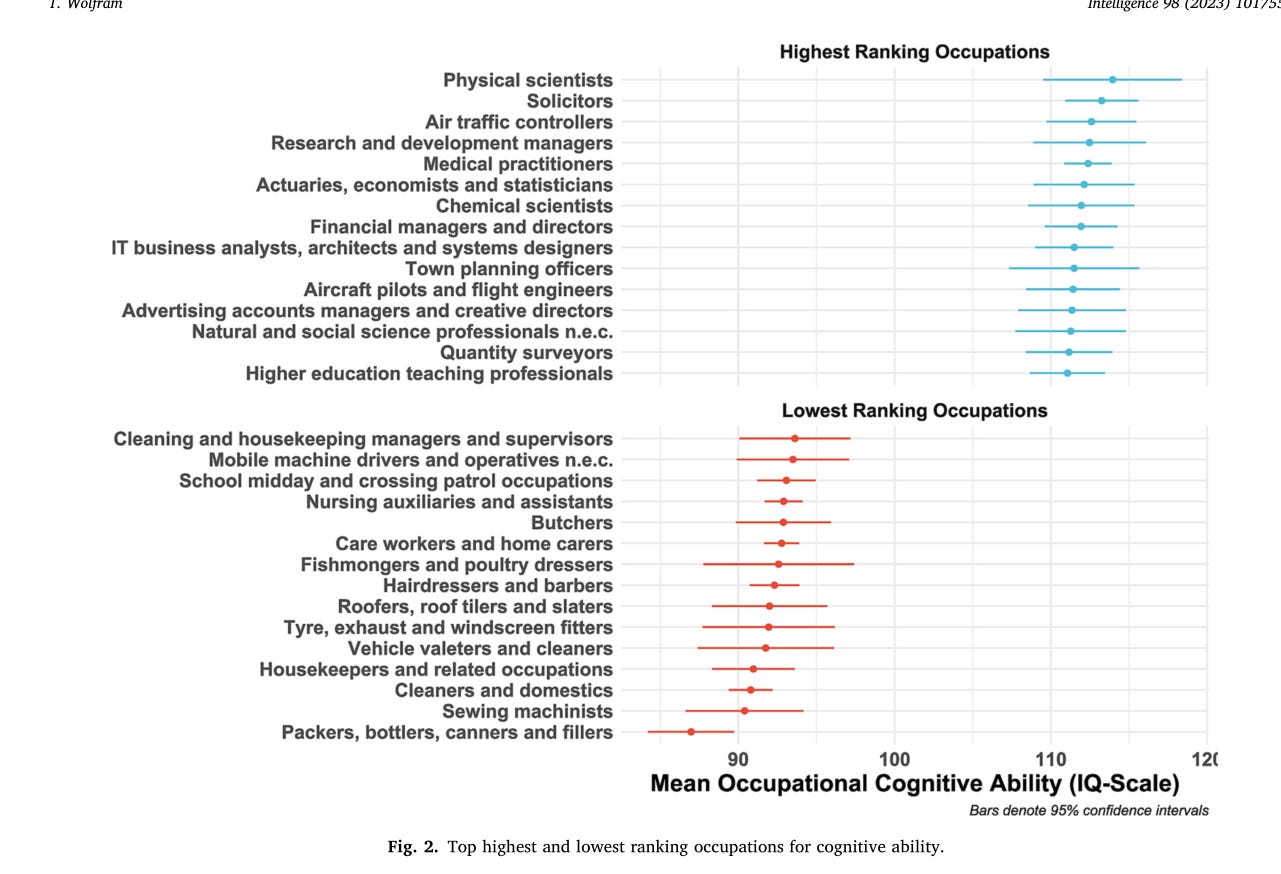
Sure enough, in his careful analysis Wolfram finds that cognitive ability is the main distinguishing feature of the occupation people end up in (there is a big sex difference in chosen occupations, which we can put to one side for a moment). He finds that less demanding occupations have a wider range of cognitive abilities, confirming Jensen’s observation with a new and very representative sample.
He also finds that personality variables have an effect (so “not just intelligence”) but they are smaller factors. Cognitive ability is much more strongly correlated with occupational status than personality or other non-cognitive measures.

Fun to see the oh-so-popular list of important non-cognitive factors (each the subject of popular books) relegated firmly to the bottom of the class.
“For cognitive ability, roughly a quarter of the total variance (24.1%) can be attributed to between-occupation differences. Homogenizing samples for sex and age show substantially stronger clustering for men (29%, compared to 24.1% for women) and older participants (30.4% compared to 23.6% for the younger half). Significant effects are found for each non-cognitive outcome (strongest for gratification delay, openness and agreeableness, weakest for mental health). Once more, homogenizing for age and sex increases the estimates in nearly all cases, with higher values obtained for men than for women.”

What is not to like?
Well, I like the paper, which is well-written, detailed, cautious and a good contribution to the literature.
What I do not like is the tests the designers of the household study decided to use.
Their rationale is given by McFall (2013): Reliable and valid, represent multiple dimensions of cognitive ability, brief, suitable for administration via other modes, have been used in other surveys.
Here is the list:
1) immediate and delayed word recall (set of 10 words)
2) Serial 7 Subtraction: This test assesses working memory, or the short‐term integration, processing, disposal and retrieval of information. (subtract 7 from 100, then 7 from the remainder and so on 5 times).
3) Number series: designed to assess fluid reasoning or the ability to use abstract thought to solve novel problems. Items from Woodcock Johnson. (fill in missing number in a series).
4) Verbal fluency (naming as many animals as possible in a minute).
5) Number problems (arithmetic: 3 easy standard items, 1 or 2 more depending on performance on first 3).
Every survey has to decide how best to use limited time. My concern is that this is mostly not an intelligence test, more a memory test. Test 1 is recall, test 2 is more recall than maths, test 3 is probably fine, test 4 is a weak measure, test 5 is better, but probably too short.


The end result is leptokurtic, rather than being a proper bell curve. Too many people in the middle because the tests lacked bite. The standard deviation is 14.34 which may just be a reflection of this in-work sample. Even if you rank-normalise the underlying factor, the tests are under-performing, and the signal is fainter than it should be.
What could they have done? Vocabulary is g loaded, and the General Social Survey Wordsum (10 words, multiple choice) would have linked this study with very large GSS results. Wordsumplus, with an extra 4 middle difficulty words improves discrimination and validity.
Digit Symbol (Coding) takes less than 2 minutes, and is a very good and well validated processing-speed measure.
Matrices: visual, non-verbal, short-form Raven’s would have provided a link with a very extensive psychometric database.
For Maths, they could have used a few PISA items, once again linking up with international data.
In contrast, UK Biobank used a 2 minute test, and despite having only 13 items, the results look more normally distributed. However, it is too short and retest reliability suffers.
https://www.unz.com/jthompson/your-iq-in-2-minutes/
I think the tests the original team used were not sufficiently discriminative, and might well have brought about a ceiling effect, making it very hard for bright people to shine. Perhaps there is more work that has been done on this test battery, but it gives the impression of being designed to avoid testing intelligence.
It is astounding that even though it is a blunt sword, it still cuts more sharply than all the other tests, including 5 factor personality measures.
Despite the poor measure, it is interesting to see the results for different occupations in the UK. The sample sizes are often small, but are included to give you an idea of how popular, or difficult to get into, each profession is. The implied standard deviations make sense. For large samples such as the 674 nurses, they have an IQ of 100 and a standard deviation of 14.5, for smaller samples such as the 27 psychologists they have an IQ of 107 and a standard deviation of 13.87. Electrical engineers, the brightest group (9 people) with an IQ of 118 have a standard deviation 13.26. For every mean result, we will expect a few persons to be a standard deviation higher than their colleagues.
The IQ levels are disturbingly low, so just look at the pecking order, rather than the absolute values, because if the mean results are remotely true, we are all in big trouble.
Here are a selection of occupations for comparative purposes:
Job Sample size IQ
Electrical engineers 9 118.4
Veterinarians 16 117.8
Physical scientists 14 114.4
Solicitors 94 114.2
Senior police officers 94 113.7
Advertising managers, creatives 25 113.9
Medical practitioners 178 112.7
Financial managers 113 112.6
Programmers, software developers 181 111.2
Pharmacists 49 111.5
Ophthalmic opticians 14 111.8
Higher education teachers 125 111.4
Physiotherapists 37 110.6
Natural & social sciences 83 110.9
Dental practitioners 26 110.1
Actuaries, economists, statisticians 29 110.5
Chartered and certified accountants 180 110.3
Secondary education teachers 524 109.7
Medical radiographers 29 108.9
Psychologists 27 107.2
Podiatrists 12 105.5
Speech and language therapists 18 105.1
Occupational therapists 32 101.4
Senior professionals of education 85 107.9
Education advisers, school inspectors 44 106.9
Business, financial project managers 156 106.9
Nurses 674 99.98
Midwives 45 98.65
The pecking order seems to make sense, though advertisers may seem surprisingly high. “Higher education teachers” must include universities, so the score is disturbingly low, and for psychologists even more so.
In summary, a good paper on a valuable dataset which provides a detailed and entertaining look at occupations, but let down by the feeble cognitive test battery. Wolfram does discuss various explanations for the cognitive results not being as high as other studies, but I think the answer lies in the test battery.
Or, our professionals are far duller than they should be.
I feel like this proportion might decrease over time as more cognitively demanding jobs get outsourced to ai. What are your thoughts on this?